Comparison between Digital Densitometer and Classical Methods in Measuring Density and Concentration
(Technical Center of Hainan Entry-Exit Inspection and Quarantine Bureau Hannan Haikou)
Overview
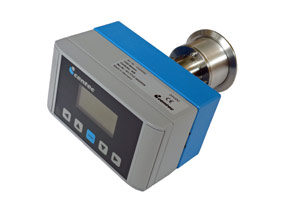
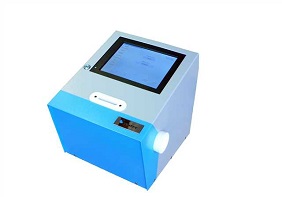
In the inspection of import and export commodities, density(specific gravity) and concentration(alcohol ,sugar) value are closely related to quality and weight. Especially in the weight identification service, the value of the goods is determined by weight, which transformed by density. Hence, accurately determine the density and concentration value matters the fair dealing in international trade. At present, methods of determination commonly used in China and international standards are densitometry method, pycnometer method and alcohol meter method. Densitometer method simple and quick, but the accuracy is poor. Commonly, densitometer and alcohol meter precisely to the two decimal places. Special densitometer precisely to the third decimal places at most and need to look up the table to transform the temperature coefficient. Pycnometer method can be precisely to the fourth decimal place, but has the drawbacks of long operation time and severely demanded by the environment temperature, it is not convenient to determine the value accurately and quickly. Author measures density and concentration value of a variety of liquid by imported digital densitometer. The instrument is controlled by a microcomputer and can be determined at one time by different settings. It can display and print density values , specific gravity values alcohol degree and sugar degree at different temperatures. The method is fast and simple. Each sampling quantity is as low as 1~2mL.Compared with classical method and analyzed data by mathematical statistics principle we find there is no significant difference between the results of these two methods.
1. Instrument and Principle
1.1 Instrument and Utensil
Digital densitometer , petroleum densitometer , alcohol meter ,sugar meter;250ml 500ml 1000ml glass measuring cylinder; constant temperature water bath thermometer.
1.2 Method and Principle
1.2.1 Instrument method
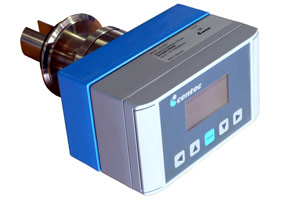
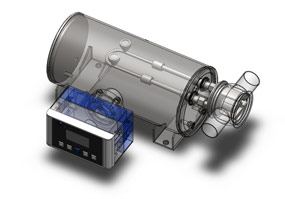
The instrument is designed by the principle of vibration of U type oscillator tube. It measures the density and specific gravity value of liquid by measuring the resonant frequency of liquid. And calculate the concentration of liquid by looking up the built-in density-concentration (sugar degree alcohol degree) table. The instrument operates simply. Inject 1~2 ml sample by injector. Keep it in the constant temperature sink for about 5 minutes and then the screen will display the density and concentration needed. The instrument will calibrated to target-temperature in the temperature range.
1.2.2 Pycnometer method
According to the principle of specific gravity. Generally refers to the specific value of the liquid mass and water mass under the same temperature and have the same volume.
1.2.3 Densimeter method
Commonly densimeter and special densimeter which designed according to the Archimedes principle. For example petroleum densimeter designed for petroleum products. Alcohol meter designed for measuring the concentration of alcohol and sugar meter designed for sugary fluid and juice products.
2. Experiment data and analysis
2.1 Significance difference test between instrument method and classical method
1). Select 10 different liquid samples and measure them specific gravity value by instrument method and pycnometer method respectively. Select 10 different petroleum products and measure them density value by instrument method and petroleum densimeter method respectively. Then use paired t test to statistic process experimental data. The results are shown in table 1 and table 2 and it proves the instrument method accords well with the pycnometer method and densimeter method.
Table 1 Comparison of measuring specific gravity value by instrument method and pycnometer method
Sample name | Instrument method(d1) | Pycnometer method(d2) | Difference value(d1-d2) |
Ethylene glycol | 1.1152 | 1.1152 | 0.0000 |
Propylene glycol | 1.0424 | 1.0427 | -0.0003 |
Butyl acetate vinegar | 0.8780 | 0.8780 | 0.0000 |
Paint thinner | 0.8518 | 0.8515 | +0.0003 |
Methanoic acid | 1.2143 | 1.2145 | -0.0002 |
40%kongfu(pesticide) | 1.0245 | 1.0244 | +0.0001 |
Dusishuai(pesticide) | 1.0872 | 1.0871 | +0.0001 |
o-xylene | 0.8817 | 0.8817 | 0.0001 |
Crude oil | 0.7938 | 0.7934 | +0.0004 |
Palm oil | 0.9137 | 0.9135 | +0.0002 |
Paired t test | Calculated t<t0.05(9) |
Table 2 Comparison of measuring density value by instrument method and petroleum densimeter method
Sample name | Instrument method(d1) | Petroleum densimeter method(d2) | Difference value(d1-d2) |
Base oil | 0.8466 | 0.8468 | -0.0002 |
Base oil(chemical materials) | 0.8928 | 0.8926 | +0.0002 |
Solvent oil(120#) | 0.7980 | 0.7977 | +0.0003 |
Unleaded gasoline | 0.7506 | 0.7504 | +0.0002 |
Aviation kerosene | 0.7887 | 0.7889 | -0.0002 |
Light diesel oil(0#) | 0.8359 | 0.8362 | -0.0003 |
Heavy diesel oil | 0.8726 | 0.8727 | -0.0001 |
Motorcycle oil(two-stroke) | 0.8821 | 0.8818 | +0.0003 |
Motorcycle oil(15w/40) | 0.8840 | 0.8837 | +0.0003 |
Motorcycle oil(15w/30) | 0.8772 | 0.8770 | +0.0002 |
Paired t test | Calculated t<t0.05(9) |
2). Results of measuring alcohol degree in different wine and edible alcohol by instrument method and alcohol meter method are shown in Table3. We measure crude wine sample and distilled wine sample. The experiment result shows that the same as the alcohol meter method, when measuring alcohol degree of wine by instrument method, only alcohol degree of distilled wine can be measured accurately. With regard to fermented wine, because it contains a lot of sugar or pigment and specific gravity of aqueous solutions of these contents are greater than 1. The effect is lower the alcohol degree value in actual measurement of alcohol. So when we measure fermented wine ,mixed wine and colored wine ,we should distill it before measure. There are no significant difference between instrument method and alcohol meter method when measuring alcohol degree in distilled wine ,mixed wine and fermented wine.
Table 3 Comparison of measuring alcohol degree by instrument method and alcohol meter method
Sample name | Instrument method(x1) | Alcohol meter method(x2) | Difference value(x1-x2) | Label value |
1# | 2# | 2# | 2# |
Martell | 38.00 | 39.27 | 39.80 | -0.53 | 40.0 |
wine | 5.68 | 12.42 | 12.61 | -0.18 | 12.0 |
Remy Martin | 38.00 | 39.52 | 39.20 | +0.32 | 40.0 |
Whiskey | 42.74 | 42.70 | 42.10 | +0.60 | 43.0 |
Haikou Da Qu | 38.02 | 38.01 | 37.90 | +0.11 | 38.0 |
Edible alcohol | - | 95.47 | 95.00 | +0.47 | - |
Paired t test | Calculated t<t0.05(5) |
Note: Liquor sample are measured in 20℃,1# represent undistilled liquor sample and 2# represent distilled liquor sample.
3). Results of measuring sugar degree in soft drinks by instrument method and sugar meter method are shown in Table4. The main ingredients in soft drinks are cane sugar and water. The content of other additives is very low and it has little effect on the determination. Generally a little higher than sweet water. Even if it does, it is a systematic error. In other word, the effect is the same for both methods. Statistical results show that there are no significant differences between these two methods when measuring the sugar degree in white gourd tea, coca cola, grape soda and Red Bull.
Table 4 Comparison of measuring sugar degree in soft drinks by instrument method and sugar meter method
Sample name | Instrument method(y1) | Sugar meter method(y2) | Difference value(y1-y2) |
White gourd tea | 8.17 | 8.16 | +0.01 |
Coca cola | 10.97 | 10.98 | -0.01 |
Grape soda | 12.23 | 12.24 | -0.01 |
Red Bull | 9.12 | 9.12 | 0.00 |
Paired t test | Calculated t<t0.05(3) |
2.1 Comparison of experimental precision of the method
Select 8 pairs parallel test data of density value and specific gravity value. Compare the precision of instrument method and pycnometer method, petroleum densimeter method and the results meet the requirements of various methods. Precision is expressed as the relative deviation of parallel tests. Details are shown in Table 5 and Table 6. Relative deviation of instrument method is in 0-0.0070%, pycnometer method is in 0.0055%~0.021%, petroleum densimeter is in 0.011%~0.025%. This shows that the precision of instrument method is high on account of its high degree of automation.
Table 5 Comparison of measuring precision between instrument method and pycnometer method
Sample name | Instrument method | Pycnometer method |
Measure results(g/cm-3) | Precision % | Measure results(g/cm-3) | Precision % |
1# | 2# | 1# | 2# |
Martell | 0.9529 | 0.9529 | 0.0000 | 0.9530 | 0.9532 | 0.0100 |
whiskey | 0.9452 | 0.9453 | 0.0053 | 0.9453 | 0.9499 | 0.0210 |
Dusibi(pesticide) | 1.0872 | 1.0873 | 0.0046 | 1.0870 | 1.0874 | 0.0180 |
Palm oil | 0.9137 | 0.9137 | 0.0000 | 0.9139 | 0.9138 | 0.0055 |
Crude oil | 0.7939 | 0.7938 | 0.0063 | 0.7940 | 0.7937 | 0.0190 |
Ethylene glycol | 1.1152 | 1.1152 | 0.0000 | 1.1150 | 1.1154 | 0.0180 |
o-xylene | 0.8817 | 0.8817 | 0.0000 | 0.8814 | 0.8812 | 0.0110 |
White gourd tea | 1.0324 | 1.0324 | 0.0000 | 1.0324 | 1.0328 | 0.0190 |
Note: sample are measured in 20℃ 1# 2# are the parallel results
Table 6 Comparison of measuring precision between instrument method and petroleum densimeter method
Sample name | Instrument method | Petroleum densimeter method |
Measure results(g/cm-3) | Precision % | Measure results(g/cm-3) | Precision % |
1# | 2# | 1# | 2# |
Base oil | 0.8466 | 0.8466 | 0.0000 | 0.8469 | 0.8647 | 0.012 |
Aviation kerosene | 0.7886 | 0.7887 | 0.0070 | 0.7887 | 0.7890 | 0.019 |
Solvent oil(120#) | 0.7980 | 0.7980 | 0.0046 | 0.7975 | 0.7979 | 0.025 |
Unleaded gasoline | 0.7506 | 0.7506 | 0.0000 | 0.7505 | 0.7503 | 0.013 |
Light diesel oil(0#) | 0.8359 | 0.8359 | 0.0000 | 0.8363 | 0.8361 | 0.012 |
Heavy diesel oil | 0.8726 | 0.8726 | 0.0000 | 0.8729 | 0.8726 | 0.017 |
Motorcycle oil(two-stroke) | 0.8821 | 0.8821 | 0.0000 | 0.8819 | 0.8817 | 0.011 |
Motorcycle oil(15w/40) | 0.8840 | 0.8840 | 0.0000 | 0.8839 | 0.8825 | 0.023 |
Note: sample are measured in 20℃ 1# 2# are the parallel results
3. Conclusion
Experimental proof digital densitometer has the remarkable superiority in contrast to classical method:
1. Easy and fast operation
2. Accurate measurement results
3. Widely used , one instrument can measure density, specific gravity, alcohol degree, sugar degree of variety samples of chemical and food products.
4. The measurement is not affected by the environment and can auto-calibrated to the target temperature in temperature ranges.
Hence, in the daily commodity inspection work, used in lieu of above classical methods can greatly improve the efficiency of work.
References:
[1] GB/T 1884 - 1992.石油和液体石油产品密度测定法(密度计法)[S].
[2] GB/T 2540 - 1981.石油产品密度测定法(比重瓶法)[S].
[3] ISO 279一1981.香油精在20℃时相对密度的测定[S].
[4] GB/T 10345.3 - 1989.白酒酒精度的试验方法[S].
[5]国家进出商品检验局数据统计专业委员会.实验室数据处理[M].北京:科学普及出版社,1992.125 -140.
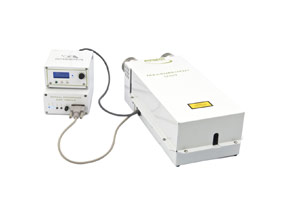
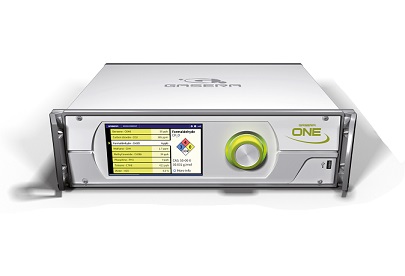
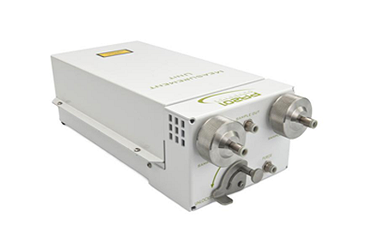
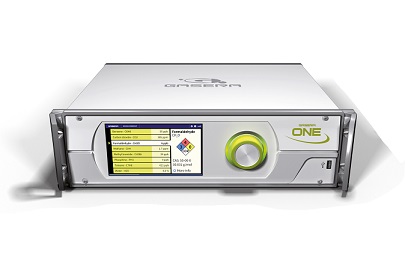
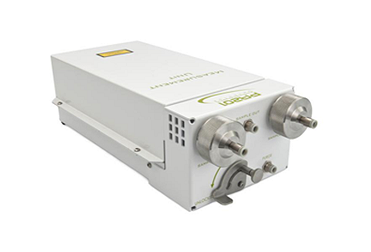
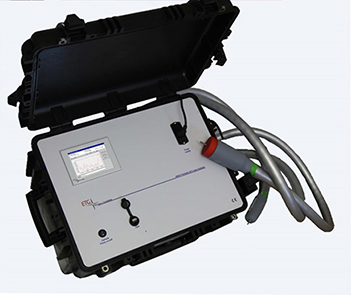
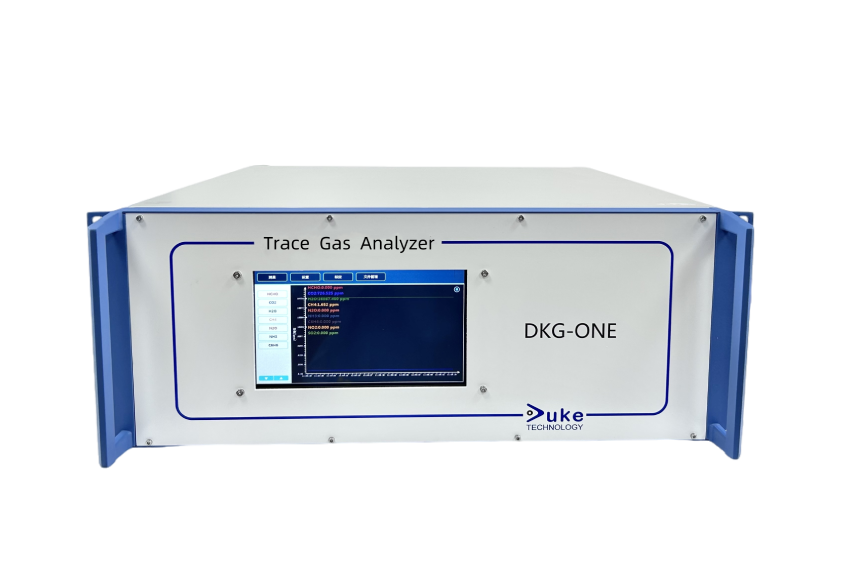 Based on infrared photoacoustic spectroscopy technology, DKG-ONE Photoacoustic Gas Analyzer combines the unique light source and detector which is a patented enhanced cantilever beam optical microphone with ultra-high sensitivity. It can be widely applied
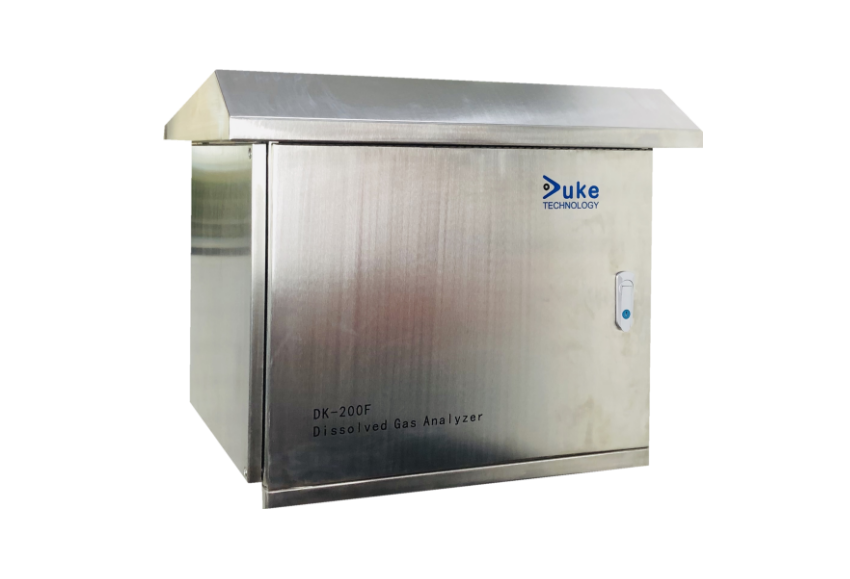 Transformer online monitoring and fault diagnosis technology is of great significance to improve the safety and stability of the power system.
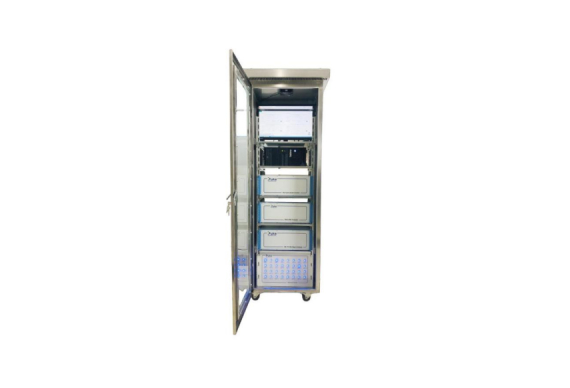 DK-BSC 3001 series battery spontaneous combustion monitoring system from Duke Technology integrates ultraviolet absorption spectrum, infrared photoacoustic spectrum, cavity enhanced absorption spectrum, Fourier infrared spectrum, tunable semiconductor abs
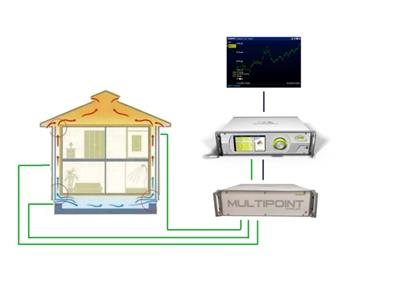 Ventilation system is to monitor the concentration change of tracer gas to calculate the ventilation efficiency.
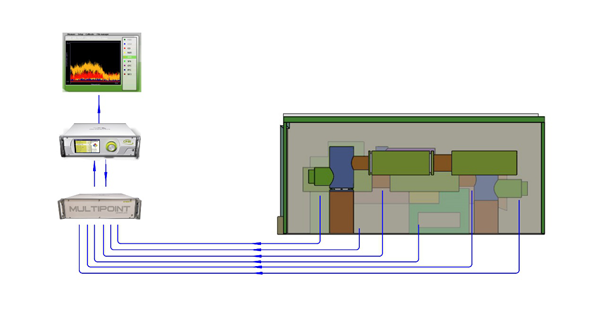 SF6 is widely used in GIS as a good insulation and interruption gas.
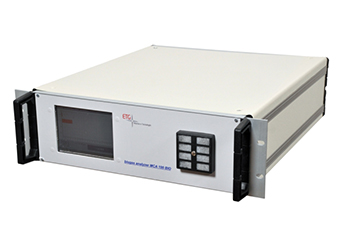
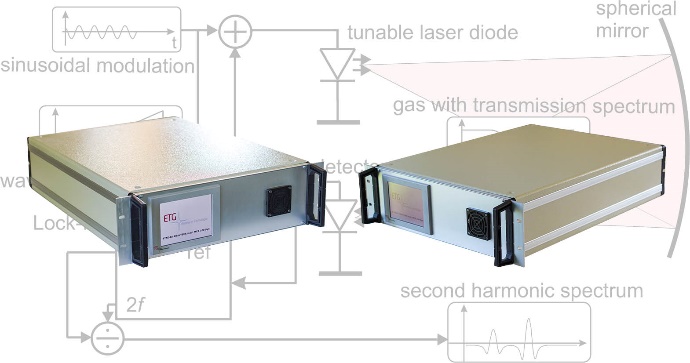


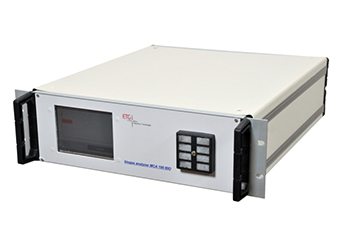
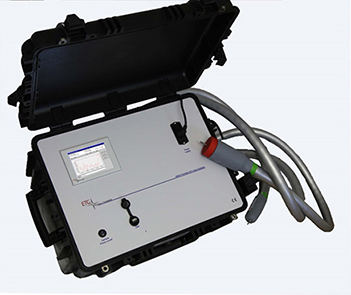
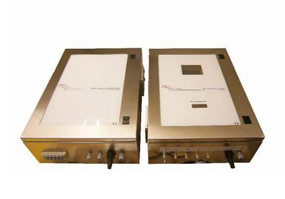



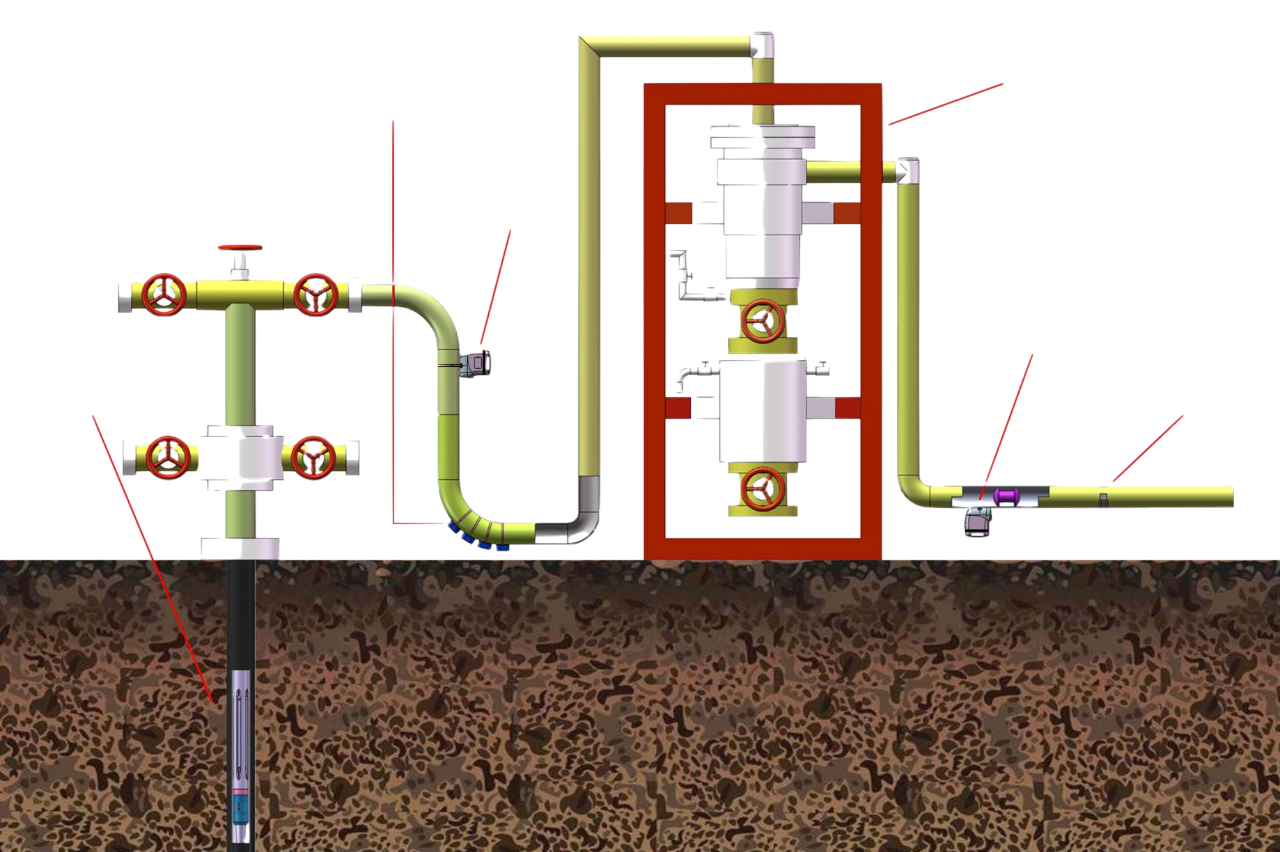
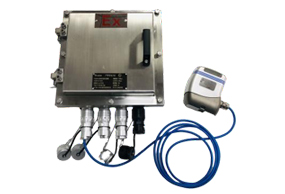 In oil or gas extraction processes, optimizing production methods is crucial. It is particularly important to accurately understand the flow rates, volumes, flow patterns, and cumulative trends of solid particles during extraction. The sand monitoring sys
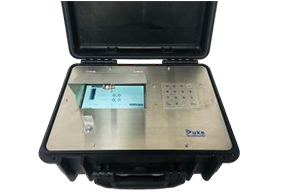 The sand monitoring system from Duke integrates the measurement of fluid patterns, flow rate, instantaneous flow, and cumulative flow of sand. It is a low-cost, real-time monitoring system for predicting the flow patterns and cumulative trends of sand.
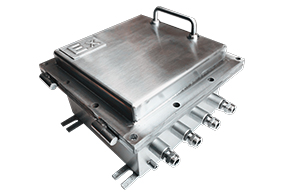 The sand monitoring system from Duke integrates the measurement of fluid patterns, flow rate, instantaneous flow, and cumulative flow of sand. It is a low-cost, real-time monitoring system for predicting the flow patterns and cumulative trends of sand.
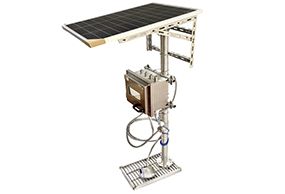 When sand enters the wells or pipelines during the extraction process, it is essential to ensure the clear passage of the sand. Real-time monitoring of the flow rate, instantaneous flow, cumulative flow, erosion rate, and movement patterns of sand/solid p
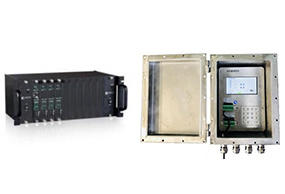 The sand monitoring system from Duke integrates the measurement of fluid patterns, flow rate, instantaneous flow, and cumulative flow of sand. It is a low-cost, real-time monitoring system for predicting the flow patterns and cumulative trends of sand.
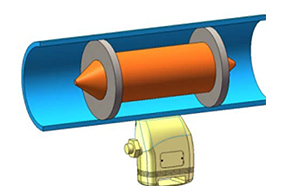 The Duke pigging indicator uses passive acoustic (ultrasonic) technology to sense the pig traveling through the pipeline, utilizing a built-in Lock Frequency Digital Signal Processor (LPDSP).
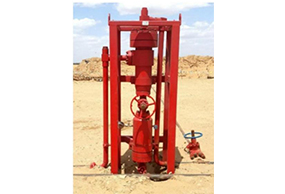 The DK-SA 830 Gas-Solid Separator operates on the principles of centrifugal sedimentation and density differences. When the fluid enters the separator tangentially at a certain pressure, it generates intense rotational motion.
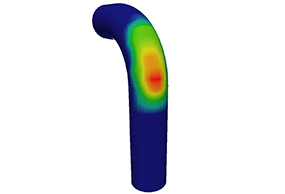 Based on echo sensing technology, the Duke Non-intrusive acoustic pipe thickness monitor uses high-frequency sound waves generated by piezoelectric transducers to pass through materials.
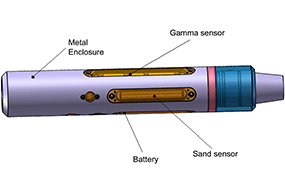 The innovative DK-SA 850 downhole sand monitoring device features a new tool architecture, integrating advanced sensor design, signal processing technology, and analytical algorithms to accurately detect downhole sand ingress points and assess sand produc
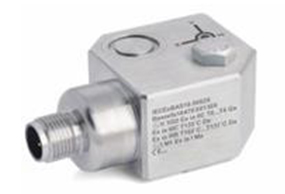 DK-SA 860-S Series Vibration Sensor can connect to analog signal output of acceleration, speed, displacement sensors, can calculate speed and displacement data based on acceleration data, features include different sensor parameter settings, data acquisit
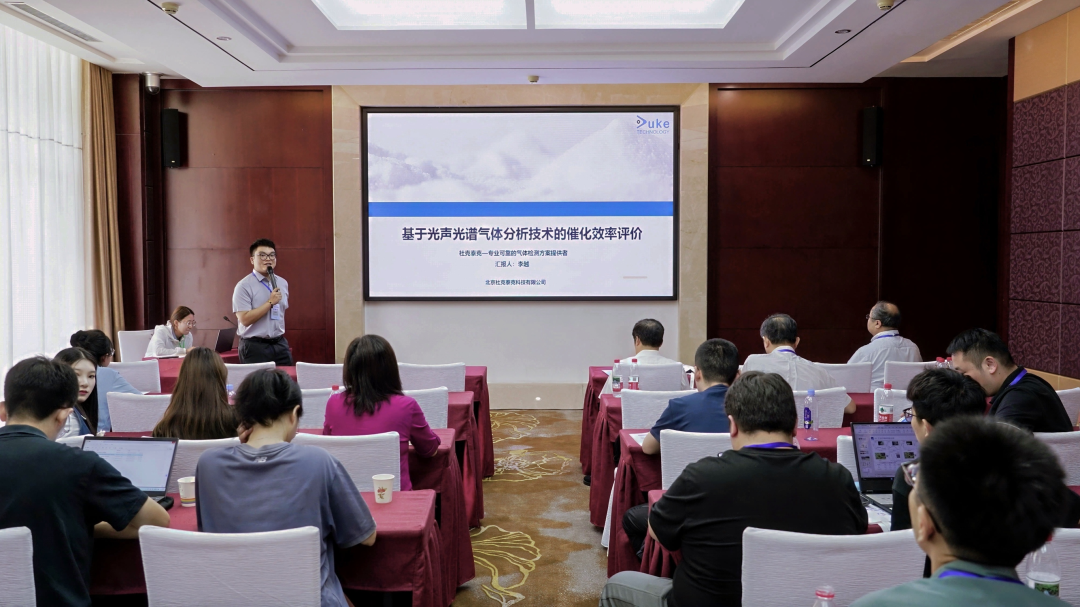
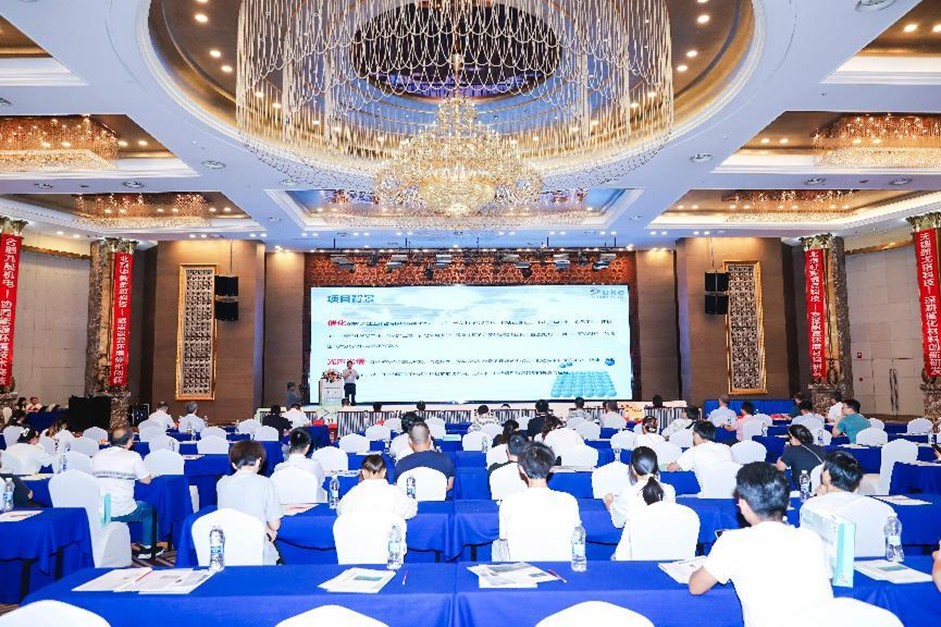
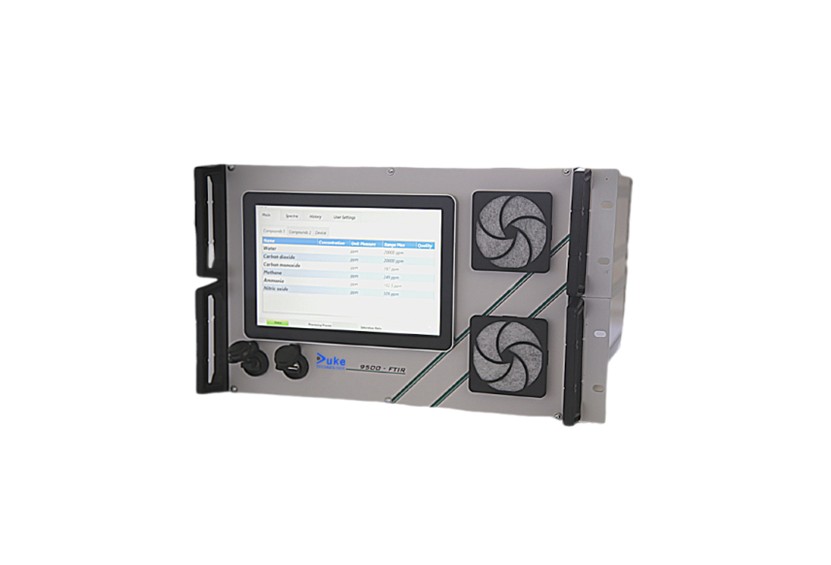
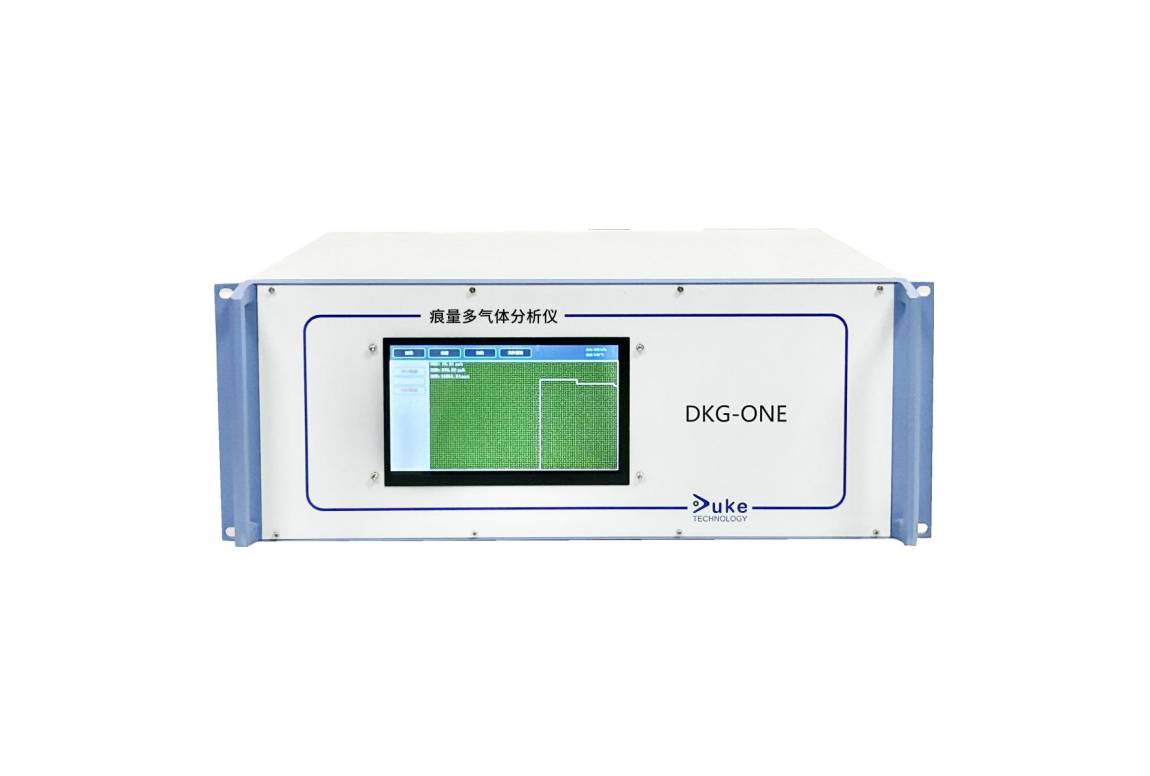 0.5 ppb detection limit: Utilising an ultra-sensitive patented optical cantilever microphone combined with a quantum cascade laser (QCL) light source, it can detect phosgene concentrations as low as 0.5 ppb, enabling precise identification of even minor l
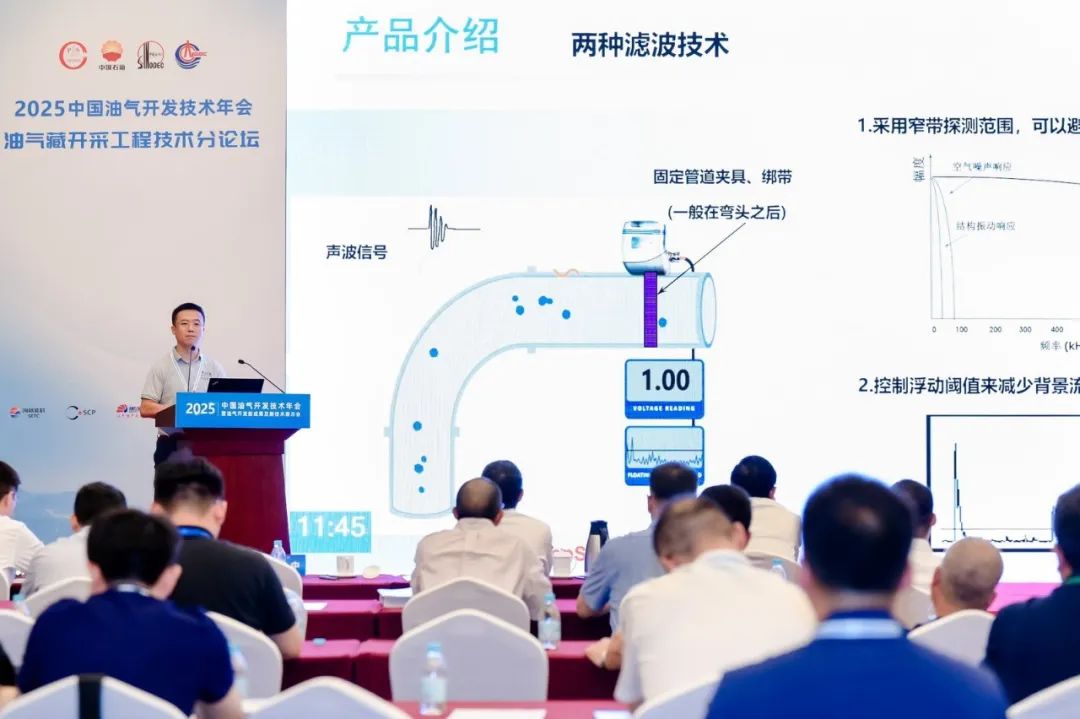
 Duke DK-F10L Photoacoustic Spectroscopy Greenhouse Gas Analyzer: The All-Around Expert for Precise Multi-Gas Monitoring
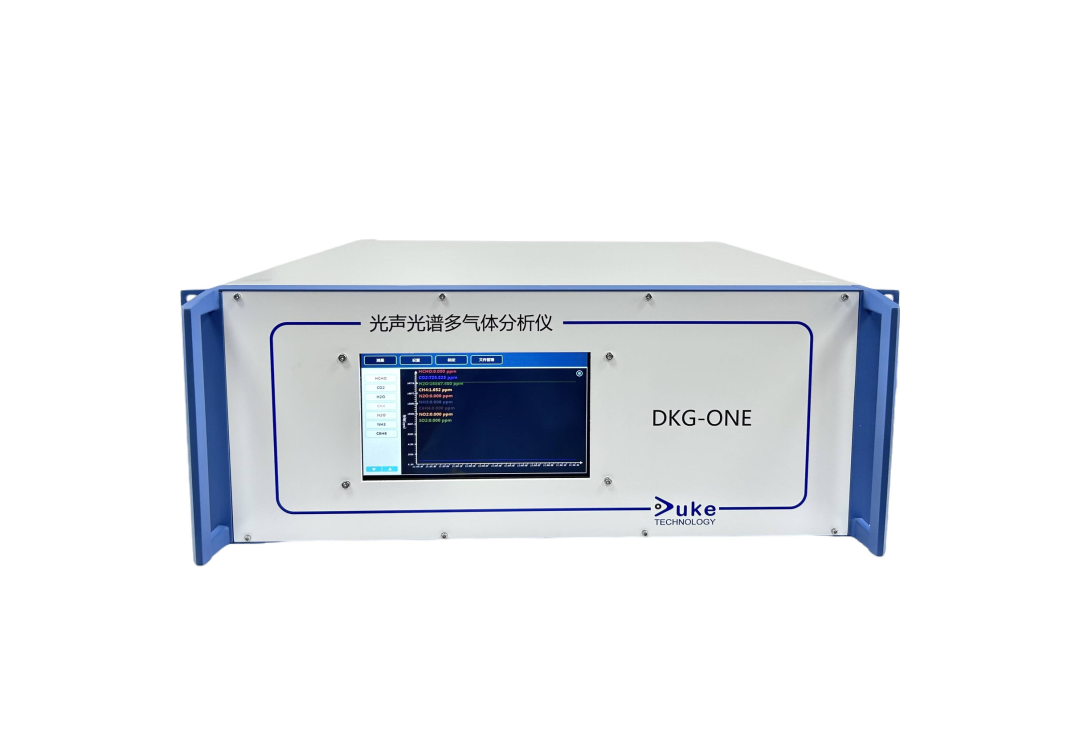 The Duke photoacoustic spectroscopy greenhouse gas analyzer
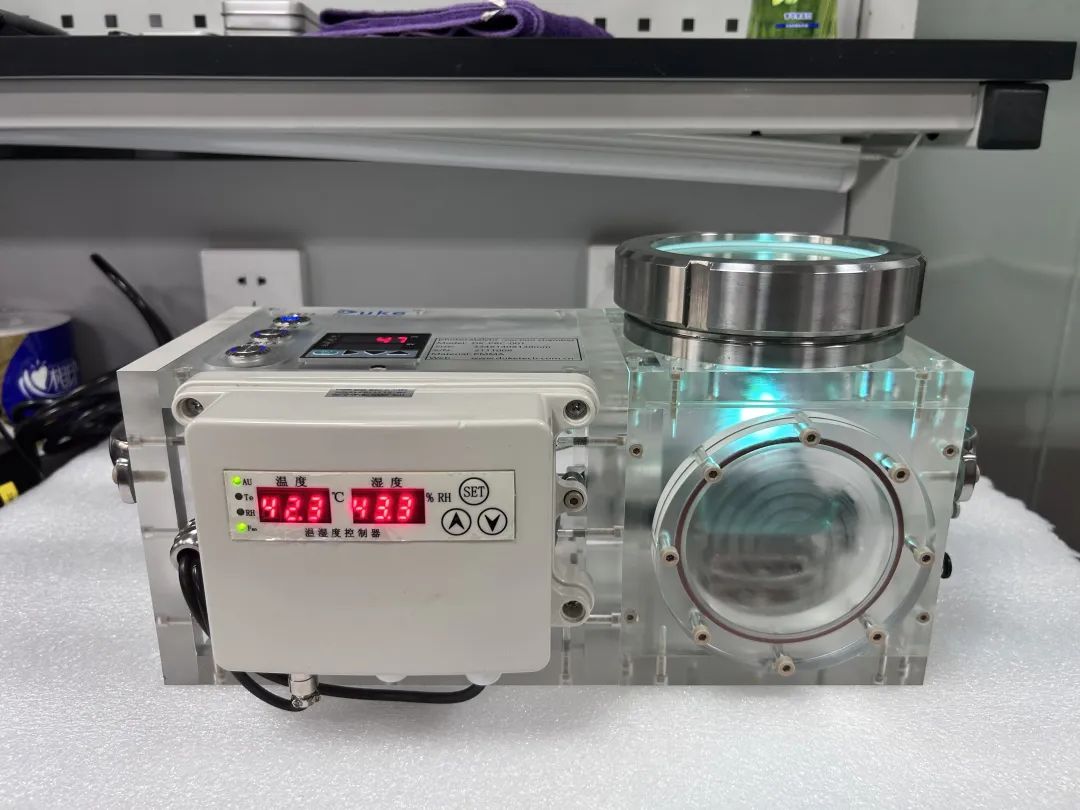 An All-Round Tool for Catalytic Research
 Infrared Photoacoustic Spectroscopy Gas Analyser